
Signal Registry
Extended EEG metrics, coherence modeling, and advanced neural state data repository
Primary EEG metrics and longitudinal Alpha–Beta state analysis are referenced in Research.
Overview
The Signal Registry contains extended EEG-derived metrics, signal decomposition outputs, and quantitative neural state indicators referenced in the Research section.
All data is derived from longitudinal Muse (4-channel EEG) recordings collected under consistent environmental conditions.
This layer represents a structured interpretation system for neural state dynamics across frequency, coherence, and stability domains.
Familiarity with these concepts supports a clearer understanding of your own biological patterns, contributing to greater awareness of internal states and long-term neural self-regulation.
How to Read This System
This layer describes how brain activity patterns map to everyday experience — including focus, calmness, mental clarity, emotional steadiness, and cognitive fatigue.
In practical terms, these metrics reflect how the brain shifts between states of focus, rest, and cognitive load. They indicate how easily the mind settles, how stable attention becomes, and how efficiently mental energy is used during daily activities such as thinking, working, and recovery.
Higher coherence and efficiency generally reflect a quieter, more organized mental state. Lower noise and faster stabilization reflect smoother transitions into focus, rest, and recovery.
Core Frequency Bands
Neural activity is analyzed across standard EEG frequency bands:
Alpha (8–12 Hz): coordinated, efficient neural activity and relaxed alertness
→ A calm but awake state — often felt when you are relaxed, present, and not mentally overworked.Beta (12–38 Hz): active cognitive processing and external task engagement
→ Day-to-day thinking, planning, decision-making, and mental effort during work or problem-solving.Delta (0.5–4 Hz): deep recovery and baseline restorative processes
→ Associated with deep rest, recovery, and physical/mental restoration (similar to sleep-like rebuilding states).Theta (4–8 Hz): internal processing, memory integration, deep focus states
→ Linked to inward attention, reflection, creativity, and “mind wandering” during problem-solving or meditation.Gamma (38+ Hz): high-frequency integration, insight and peak cognitive binding
→ Fast integration moments — often associated with insight, “aha” clarity, or high cognitive load.
Signal Dynamics Summary
In practical terms, these patterns describe how quickly the brain settles from active thinking into more stable, efficient, and focused states.
Core system behaviors
Rapid reduction in Beta and Gamma activity (~12–16 second onset window)
Strong cross-frequency coupling with Alpha–Theta dominance
Phase-lock synchronization across neural networks
Sustained high-stability flow states (>96%)
Low-variance coherence windows maintained over time
Aggregate system shifts
Power reduction: ~15.4% average across sessions
Beta suppression: ~25% within ~12 seconds (initial transition window)
Coherence increase: +172% relative to baseline
Sustained coherence level: 0.30 (stabilized state)
Regional coherence shifts
Frontal coherence: 0.11 → 0.17 (sustained)
Temporal coherence: 0.16 → 0.81 (peak range)
System-level stability
Stability index: 96.5% average
Hemispheric balance: 86.7% symmetry
Core Signal Ratios
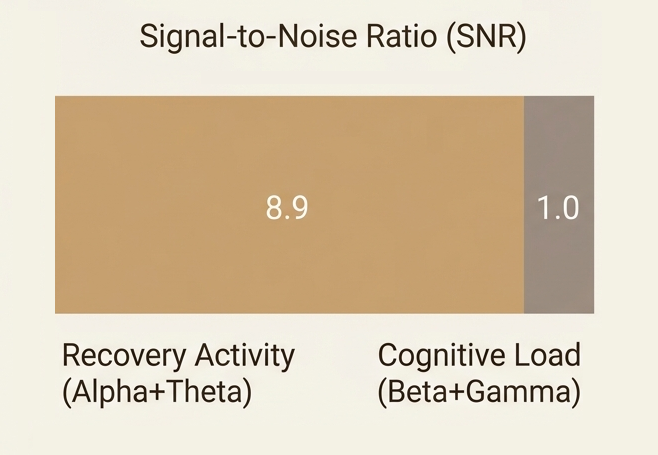
Signal-to-Noise Ratio (SNR)
Signal-to-noise ratio across sessions: 8.9 : 1
Derived interpretation:
Alpha + Theta (regulatory/recovery activity)
Beta + Gamma (high-frequency cognitive load)
Regulatory balance ratio:
8.9 : 1 (recovery-dominant state)
This suggests a strong bias toward low-noise, recovery-oriented neural dynamics during observed sessions.
In daily life, this reflects how “quiet” the mind feels — higher values suggest less mental clutter, fewer intrusive thoughts, and smoother cognitive flow.
Beta–Gamma Suppression Index (Stress Shield)
Beta–Gamma suppression is a component of the broader Alpha–Theta / Beta–Gamma balance system.
Composite stress regulation metric:
Beta suppression: 49.08%
Gamma suppression: 48.95%
Combined suppression (Beta + Gamma): 49.84%
This reflects a reduction in high-frequency cognitive load associated with internal noise and overactivation.
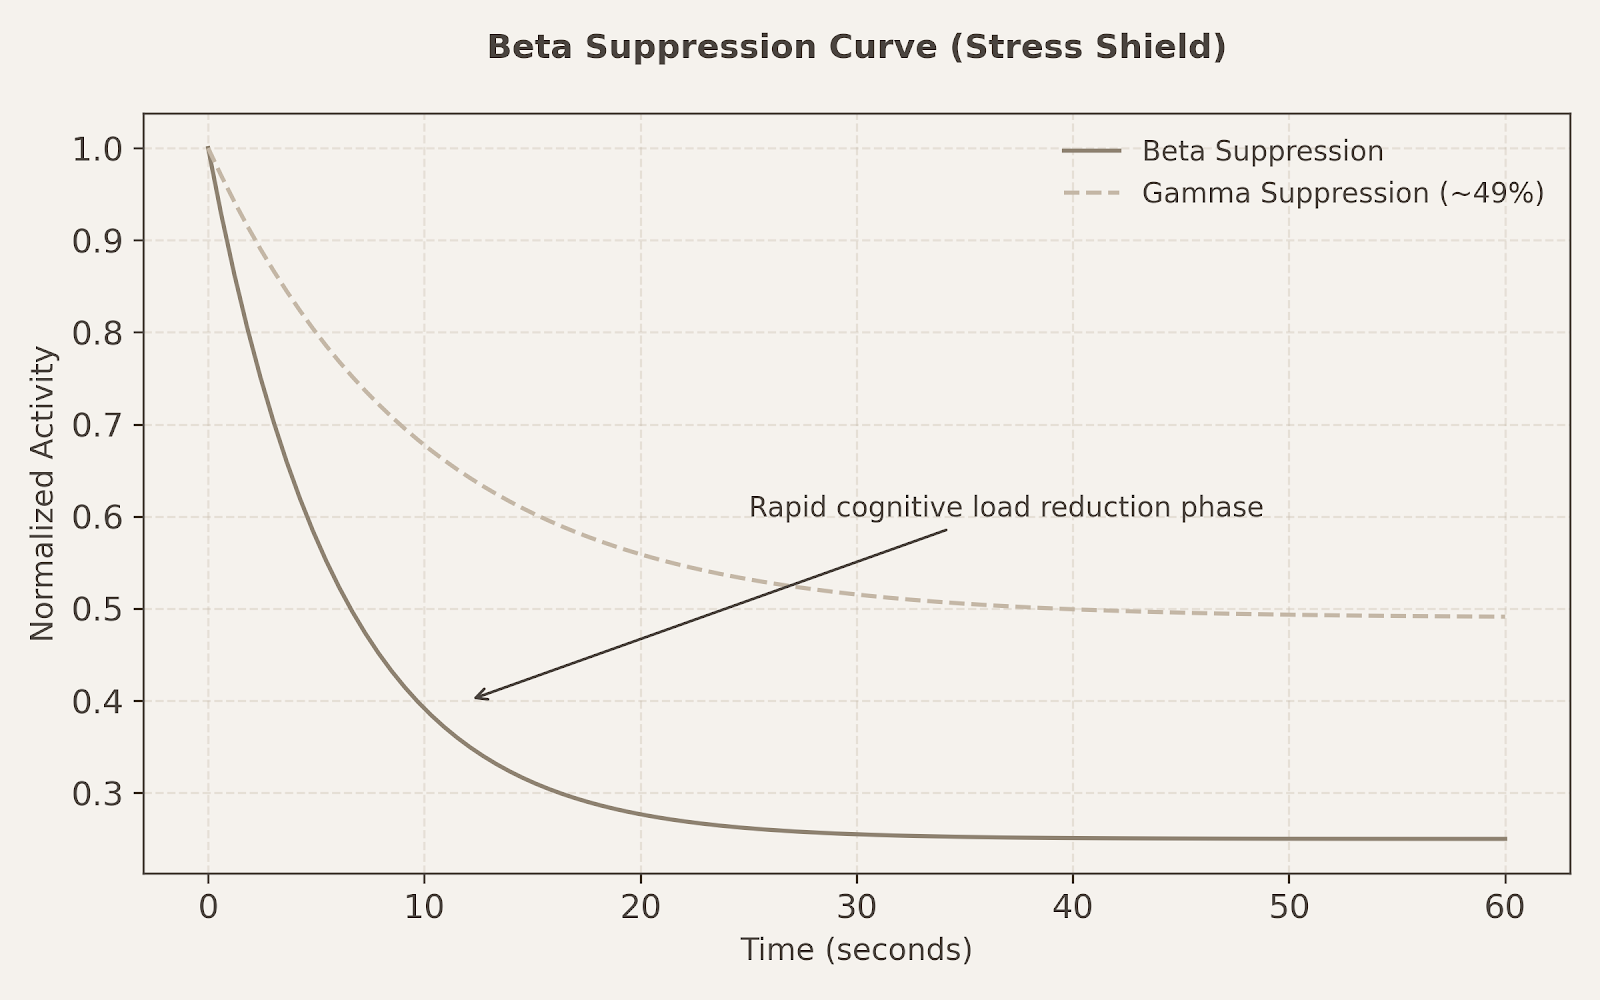
In practical terms, this reflects how quickly the brain reduces stress-related activity such as overthinking, mental tension, or cognitive overload.
Band Ratio System
These ratios describe how different types of brain activity relate to each other, helping to reveal patterns of mental clarity, focus stability, cognitive load, and fatigue levels in everyday life.
Delta–Alpha Ratio (DAR)
Cognitive clarity and fatigue index.
DAR: 0.75 (exceptional)
Reference: <1.0 = optimal wakeful clarity, 1.5 = cognitive fatigue zone, 2.0 = high fatigue / low efficiency state
Interpretation:
Strong alpha dominance relative to delta activity, consistent with alert, low-fatigue neural state.
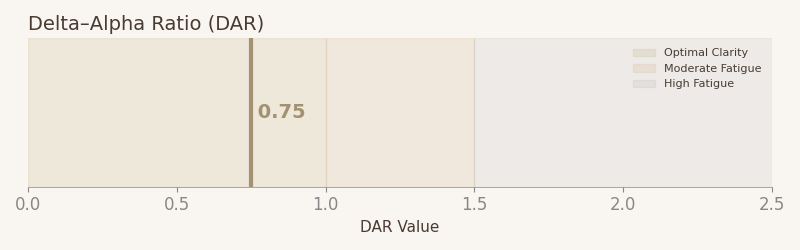
In daily experience, this relates to mental sharpness, clarity on waking states, and how “light or heavy” thinking feels.
Theta–Beta Ratio (TBR)
Cognitive control and attentional regulation index.
TBR: 1.95 (high-functioning range)
Ranges:
<1.0 → overfocused / anxious dominance
1–2 → balanced executive function
3 → high distractibility / low control states
Interpretation:
Indicates strong attentional regulation with maintained cognitive flexibility.
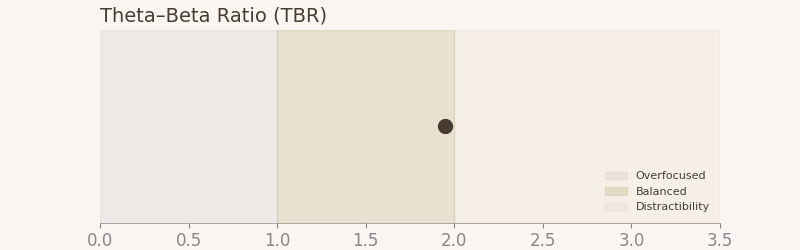
In everyday terms, this reflects how well attention is held without drifting or becoming mentally scattered.
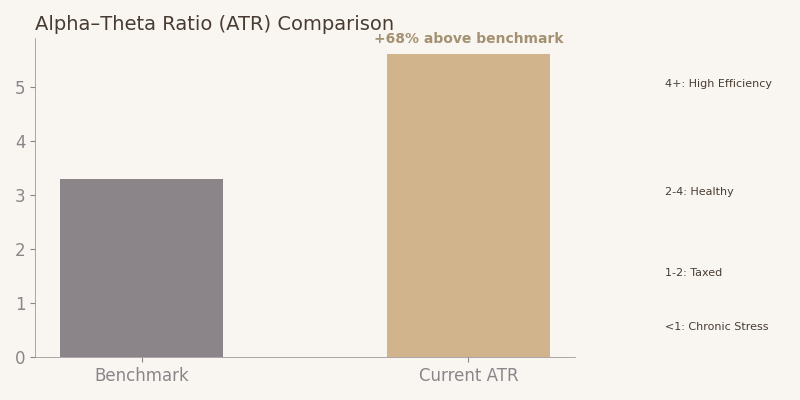
Alpha–Theta Ratio (ATR)
Cognitive efficiency and neural adaptability index.
ATR: 5.61 (high-resilience range)
+68% above healthy adult benchmark
Ranges:
<1 → chronic stress load
1–2 → cognitively taxed
2–4 → healthy adaptive baseline
4 → high efficiency / resilient cognition
Interpretation:
Represents elevated neural efficiency with strong adaptive flexibility.
In lived experience, this reflects cognitive “smoothness” — how easily the mind stays calm, adaptable, and mentally efficient under changing demands.
Coherence System
This section describes how different brain regions coordinate during focus, rest, and cognitive activity.
What Coherence Means in Simple Terms
Coherence describes how synchronized different regions of the brain are while processing information. Higher coherence reflects more coordinated communication between regions, which is often experienced as clearer thinking, smoother attention, and reduced mental fragmentation.
Lower coherence reflects more scattered or fragmented processing, where thoughts feel less connected or more effortful to hold together.
Global Brain Coherence Index
Cross-channel phase synchronization metric.
Baseline: 0.11
Sustained: 0.30
Net increase: +0.19 (+172%)
Optimal flow range: 0.25–0.40
Interpretation:
System operates within stable flow-compatible coherence band.
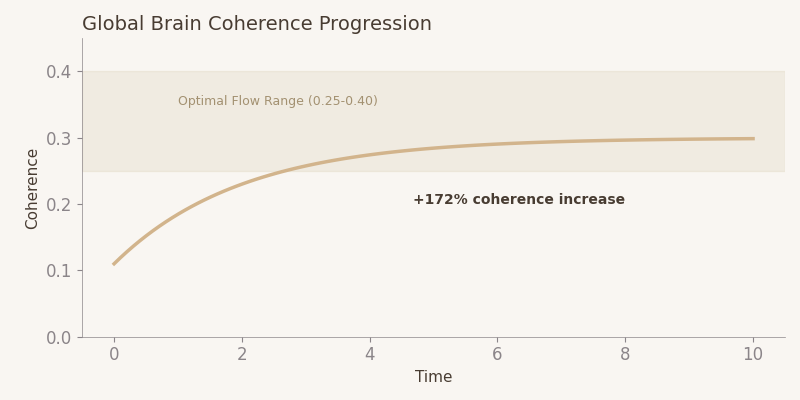
In simple terms, this reflects how “synchronized” different brain regions are — higher coherence often corresponds to clearer thinking and more stable attention.
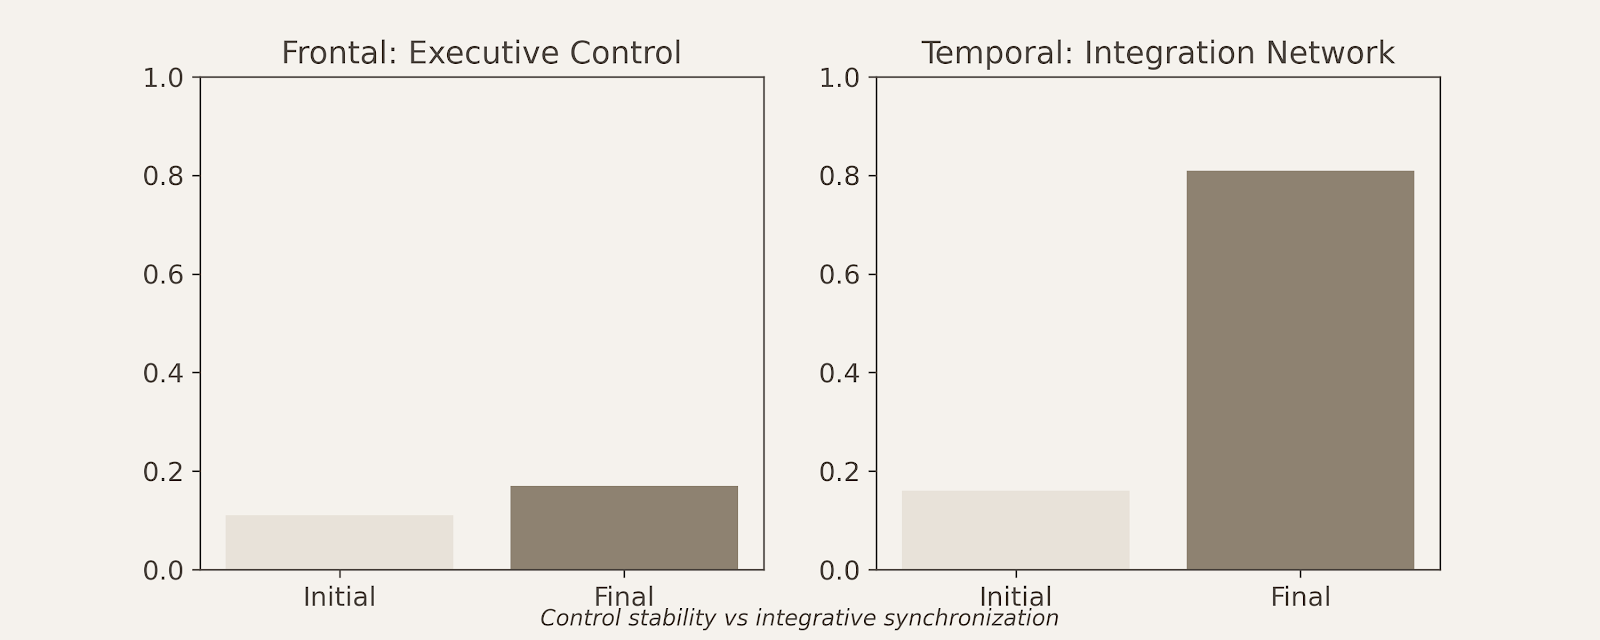
Regional Coherence Subsystems
Different brain regions contribute to different aspects of cognition and regulation. The frontal regions are associated more with executive control and decision-making, while temporal regions are more closely linked to memory integration, emotional processing, and internal sensory coordination.
Frontal Coherence (Executive Control)
0.11 → 0.17
+55% increase
Interpretation:
Stable executive engagement without rigidity.
Temporal Coherence (Integration Network)
0.16 → 0.81
+406% increase
Interpretation:
Strong phase-locking across temporal processing systems associated with integrative neural coordination.
In everyday experience:
Frontal coherence relates to planning, decision-making, and the ability to hold focus without over-control or mental tension.
Temporal coherence reflects smoother internal thought flow, memory continuity, and a more unified sense of mental experience.
Coherence Mechanism (System Model)
This sequence describes how the brain moves from mental noise → integration → stable focus.
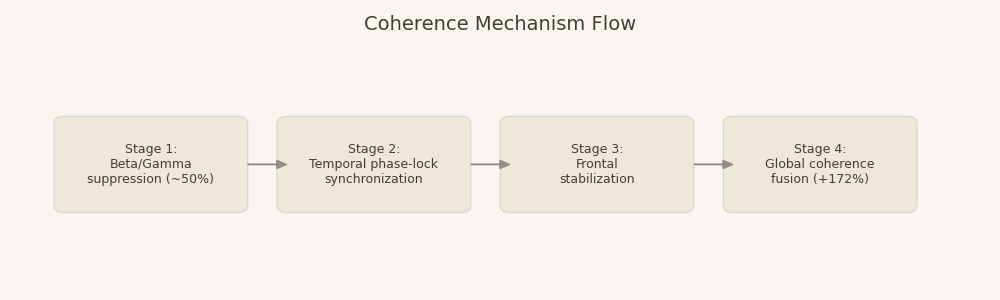
Observed sequence:
High-frequency suppression (Beta/Gamma ↓ ~50%)
Temporal phase-locking (integration spike)
Frontal stabilization (adaptive control maintained)
System-wide coherence fusion (+172% net gain)
Stability & Efficiency Metrics
These metrics describe how consistently the brain maintains stable focus and how efficiently it uses mental energy while doing so.
System Stability Index
96.5% average stability
Interpretation:
Low variance neural state with sustained coherence maintenance across time windows.
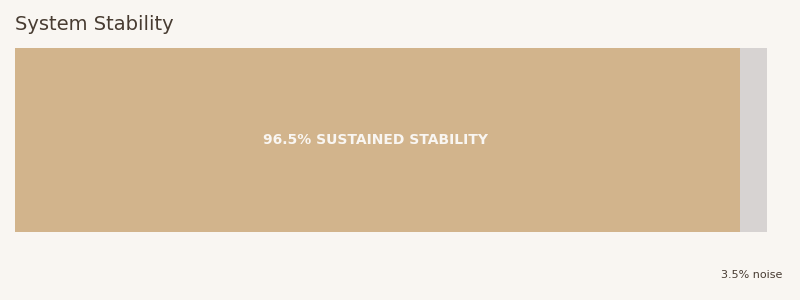
In everyday life, this reflects how consistently you can stay focused without frequent mental drifting or interruption.
Neural Power Efficiency
Average power reduction: 15.4%
Interpretation:
Reduced metabolic load while maintaining or improving functional output efficiency.
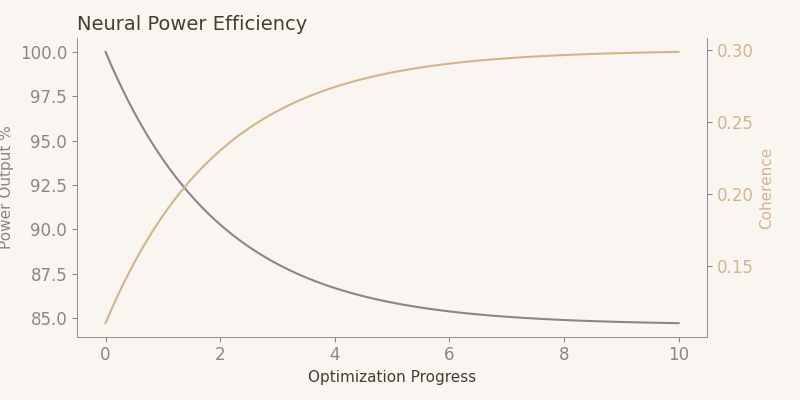
In daily life, this reflects mental energy efficiency — how much clarity is achieved with less cognitive effort or internal noise.
Hemispheric Symmetry & Emotional Regulation
This section reflects how balanced the brain is across emotional and logical processing systems, influencing emotional steadiness, reactivity, and overall internal regulation.
Hemispheric Symmetry Index
86.7% symmetry
Reference band: 45–55% (balanced population range)
Interpretation:
High inter-hemispheric balance consistent with stable cognitive-emotional integration.
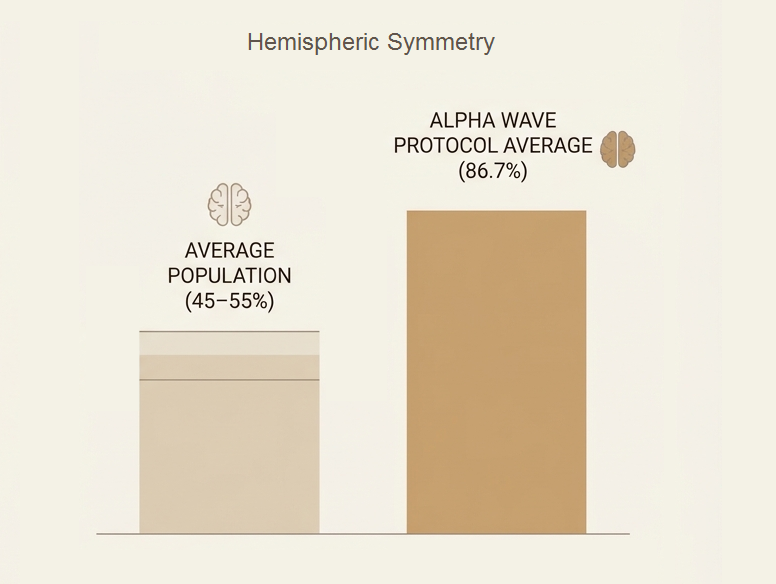
In lived terms, this reflects balanced thinking — neither side of the brain over-dominating emotional or logical processing.
Frontal Alpha Asymmetry (FAA)
Mean: -0.00078
Interpretation:
Near-neutral affective baseline with minimal approach/withdrawal bias, indicating stable emotional regulatory tone.
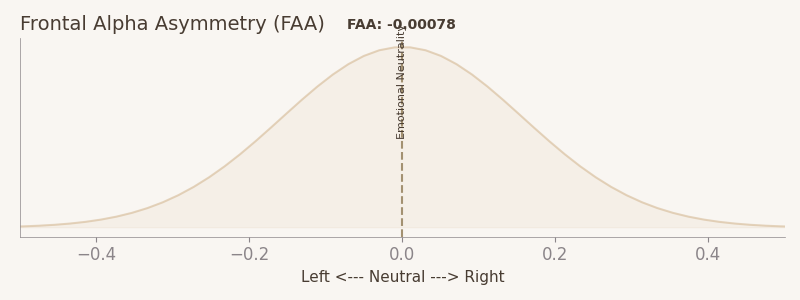
In simple terms, this reflects emotional neutrality — the ability to stay balanced instead of reacting strongly toward stress or reward.
Measurement Framework & Constraints
This section defines the conditions and limitations under which the data is collected and interpreted, ensuring clarity around scope, resolution, and non-clinical context.
Data Acquisition
Data acquisition includes:
EEG band activity (Delta, Theta, Alpha, Beta, Gamma)
Derived ratio metrics across frequency bands
Cross-channel coherence analysis
Frontal and temporal signal separation
Signal stability and variance tracking over time
Auxiliary motion tracking (accelerometer + gyroscope) for artifact filtering
Measurement Limitations
Constraints include:
Consumer-grade EEG (Muse 4-channel system)
Limited spatial resolution compared to clinical EEG systems
Artifact sensitivity to movement and environmental interference
Observations are directional and non-clinical in nature
These insights are descriptive and observational, intended to support understanding of neural patterns rather than define medical or clinical states.
External Reference Layer
A subset of expanded signal breakdowns, raw session exports, and extended statistical modeling is maintained separately.
This layer contains raw signal exports, full-session waveforms, and extended analytical datasets used to generate the summarized metrics in this registry. It supports deeper validation, replication, and extended research exploration.
Research Collaboration
Neural Sovereignty Institute™ welcomes collaboration from neuroscience researchers, cognitive labs, and neural modeling groups.
Focus areas:
replication of Alpha–Beta transition dynamics
cross-device validation of coherence metrics
advanced signal decomposition modeling
longitudinal neural adaptation tracking
State determines performance